CourseKata Chapter 6: Part II

Sampling

Mansour Abdoli, PhD

Today: From Samples to Distributions

Session Goals

By the end of today, you can:

  • Simulate a sampling distribution of the mean
  • Connect LLN to sampling distributions
  • Identify unusual (unexpected) events
  • See why normal distributions appear naturally

Important Idea

Statistics Are Random Variables

  • A statistic summarizes a sample.
  • Categorical → proportion
  • Quantitative: mean, SD, median, …

Random samples → Variable statistics

  • Distribution of Statistics:
    • What is its mean?
    • What is its variance?
    • What is its distribution shape?

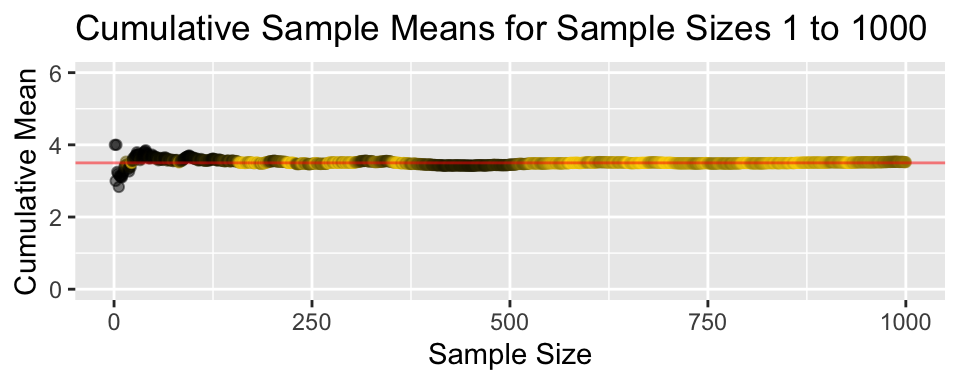
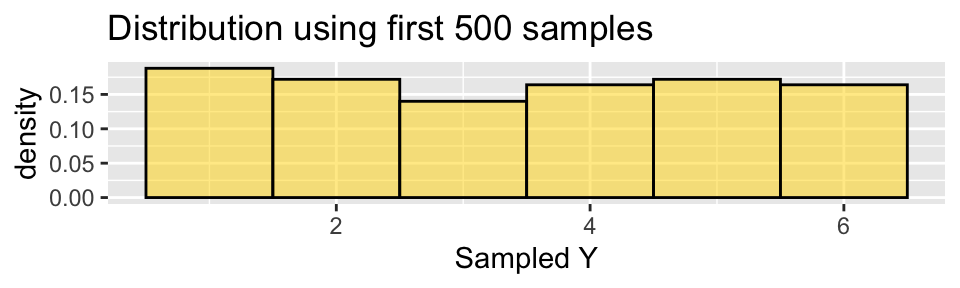
Law of Large Numbers (LLN)

  • Estimating the Distribution of a Statistic:
    • Use a large number of observed statistic
    • The mean converges faster than the distribution

Sampling Distribution of the Mean

Steps:

  1. Draw random sample
  2. Compute mean
  3. Repeat many times
  4. Plot distribution of sample means

Sampling Distribution for Size \(n\)


  • What do you notice?
  • What happens if a larger \(n\) is used?

Key Patterns

As sample size increases:

  • Mean of sample means ≈ population mean (LLN)
  • Variance decreases \[Var(\bar{Y}) = \frac{\sigma^2}{n}\]
  • Distribution becomes smoother
    • More possible sample means.
  • Shape becomes more symmetric (bell-shaped)
    • Central Limit Theorem

Central Limit Theorem (CLT)

  • As \(n\) increases,
    • \(\bar Y\) distribution approaches a Normal shape
    • with a mean equal to the population mean \(\mu\)
    • and a smaller variance \(\frac{\sigma^2}{n}\)
  • In other words: for large \(n\)’s \[\bar Y \hat \sim N(\mu, \sigma/\sqrt{n})\]

What is a Large \(n\)?

  • Any \(n\) works for \(Y\sim N(\mu, \sigma)\)
  • \(n\ge30\) is good for approximately symmetric \(Y\)-distributions.
  • For heavily skewed distribution of \(Y\), use simulation to check.

Checling \(n\) by Simulation

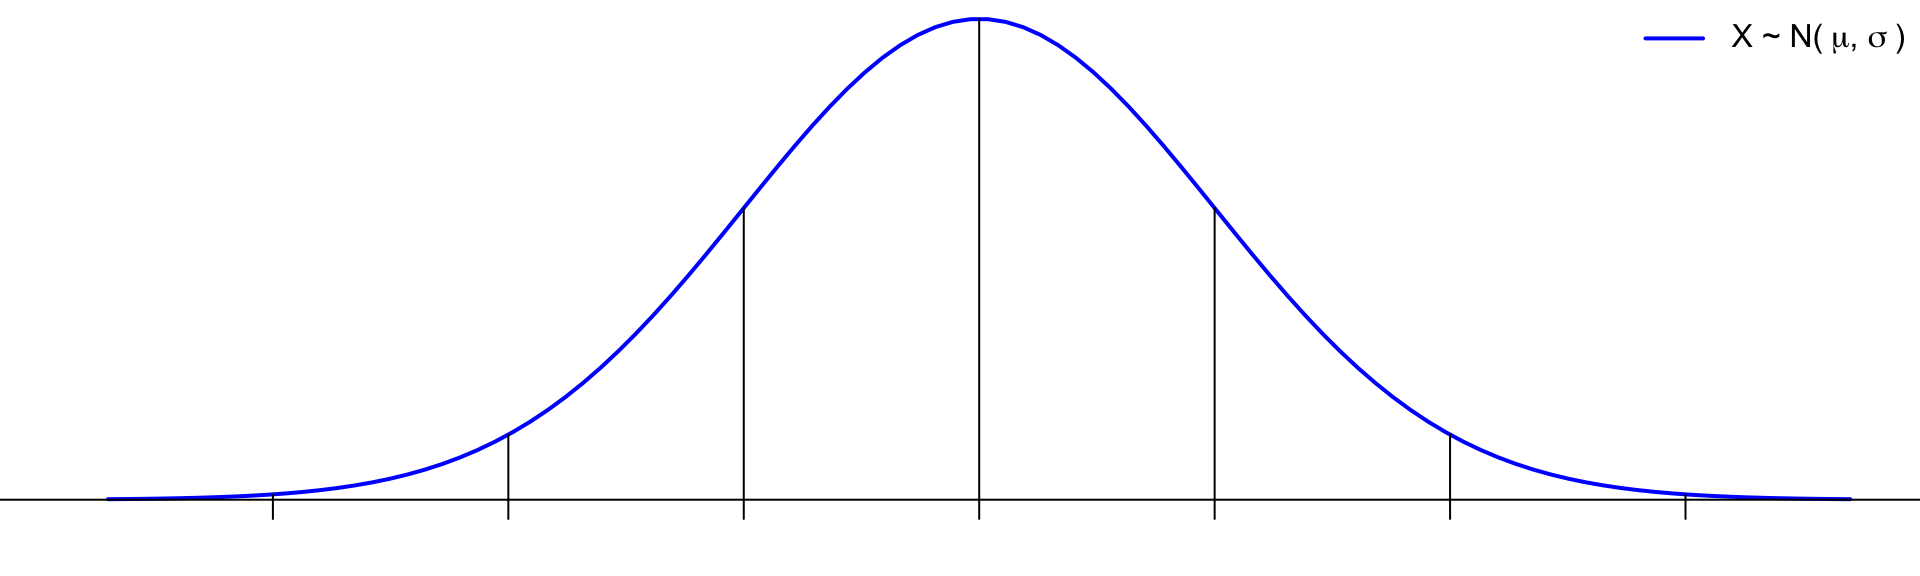
Normal Density & Empirical Rule

  • Normal Distribution & Empirical Rule:
    • 68% of values fall in \((\mu-\sigma, \mu+\sigma)\)
    • 95% of values fall in \((\mu-2\sigma, \mu+2\sigma)\)
    • 99.7% of values fall in \((\mu-3\sigma, \mu+3\sigma)\)

Unusual Events

Expected events (e.g. sample mean = population mean) could be unusual:

Unexpected Unusual Events (Tails)

Events away from expected events

  • Farther away from the center: Lower tail probability

Testing Claims (Hypothesis Testing)

  • Claim: The die used is fair (\(H_0\))
  • Roll a dies 40 times and get \(\bar Y = 4.3\)
  • Is it too far? Is it too unlikely?