CourseKata Chapter 3.1–3.9

Examining Distributions

Mansour Abdoli, PhD

Today (Ch. 3.1–3.8)

Session goals

By the end of today, you can:

  • Explain what a distribution is (pattern of variation in a variable)
  • Build and interpret histograms
  • Describe a distribution using shape, center, spread, and unusual features
  • Compute the five-number summary and interpret quartiles
  • Create and interpret box plots
  • Identify outliers using the 1.5×IQR rule

3.1 The concept of distribution

Big idea

A distribution is the pattern of variation in a variable.

  • We look at all values together
  • We summarize and visualize the pattern

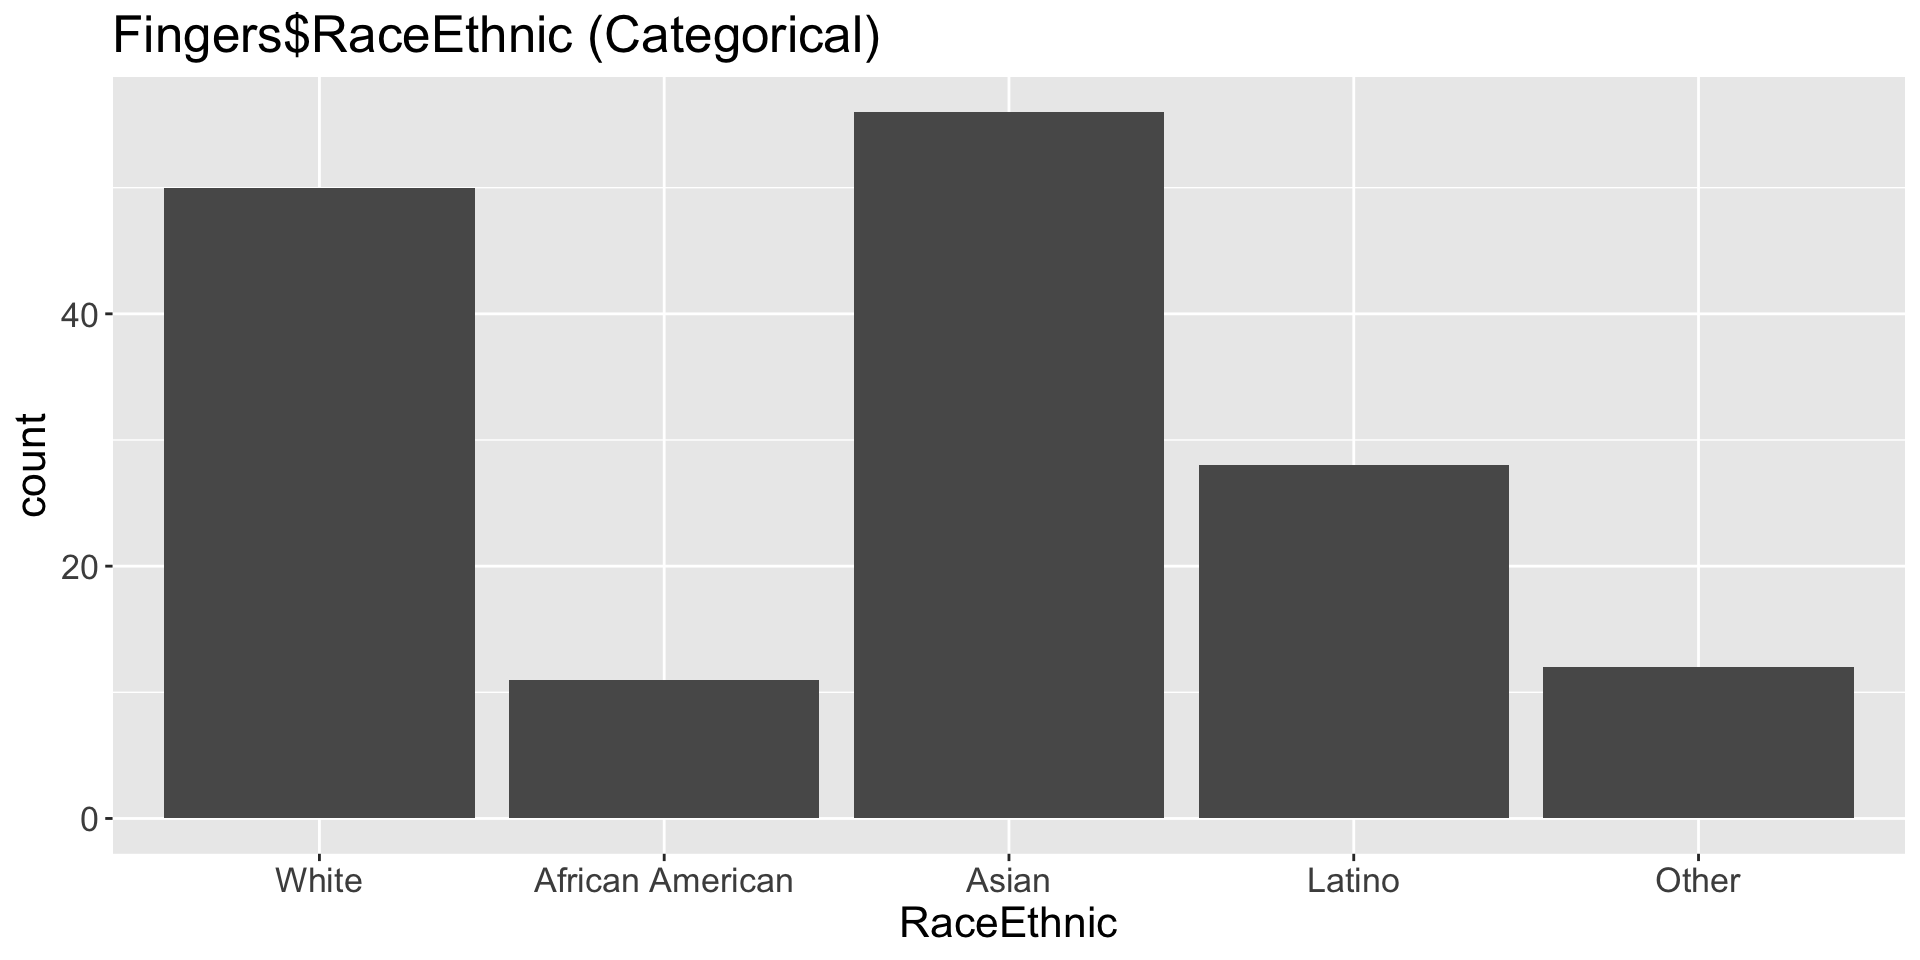
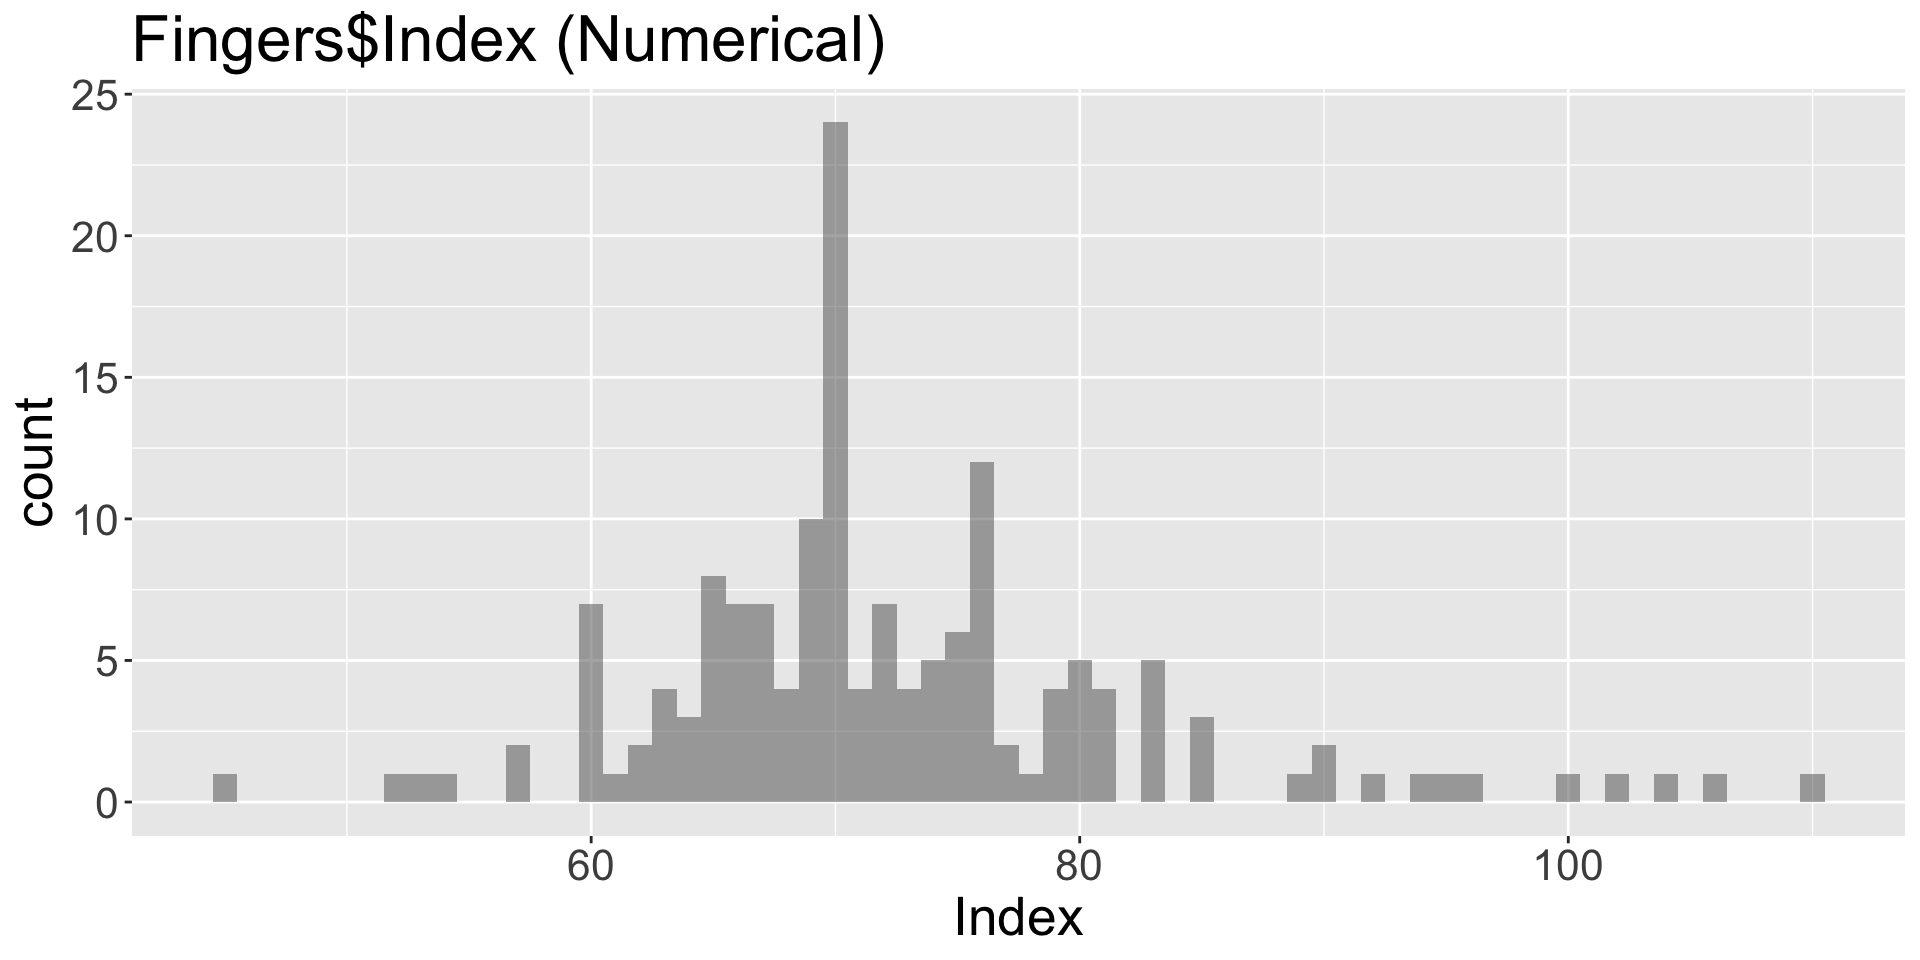
  • What are distribution characteristics in each case?
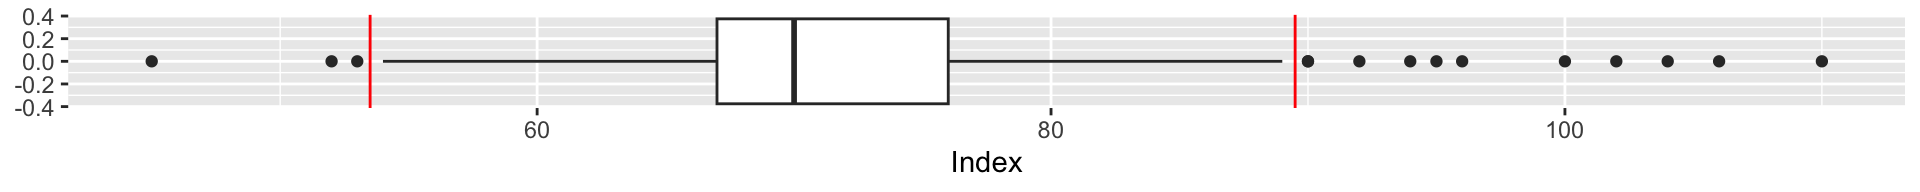
Summary Statistics

RaceEthnic
           White African American            Asian           Latino 
              50               11               56               28 
           Other 
              12 
Index
       min Q1 median Q3 max     mean       sd   n missing
        45 67     70 76 110 72.50666 10.02764 157       0


Pair prompt (1–2 min):

  • What do these summary tell you, and what do they hide?

3.2 Histograms

What a histogram shows


  • x-axis: values (bins)
  • y-axis: counts (or density)
  • reveals shape + spread quickly

3.3 Visualizing data with histograms

Bin width matters

  • Which bin width best shows the overall pattern without “too much noise”?

3.4 Shape, center, spread, and weird things

A checklist for describing a distribution

  • Shape: symmetric? skewed? unimodal/bimodal?
  • Center: typical value
    • mode, median or mean
  • Spread: how variable? how concentrated?
    • Range \((=Max - Min)\), Standard Deviation, IQR
  • Weird things: gaps, clusters, outliers
    • Outliers: far away from typical \(\equiv\) unlikely tail

3.5 The five-number summary

Five numbers that tell a lot

  • min, Q1, median, Q3, max
Population [of Countries]:
      min    Q1 median     Q3    max     mean       sd   n missing
     0.29 4.455  10.48 31.225 1304.5 44.14545 145.4893 143       0
  • Interpretation check:
    • What is the population of the largest country?
    • Could data be skewed?
    • What does Q1 mean in plain language?
    • What does IQR(\(=Q_3-Q_1\)) represent?

3.6 Quartiles and the five-number summary

Quartiles = cutpoints

  • Q1: about 25% of values are below
  • Median: about 50% below
  • Q3: about 75% below
  • “Half the countries have a population _______.”
  • “The population of a quarter of countries is _______.”

3.7 Box plots and the five-number summary

Picturing the Five-number summary

Index Distribution

Index Distribution by Gender

  • Which group has the higher median Index length?

3.8 Outliers on a box plot

The 1.5×IQR rule

  • Lower fence: Q1 − 1.5×IQR
  • Upper fence: Q3 + 1.5×IQR
  • Values beyond fences are flagged as outliers
 min Q1 median Q3 max
  45 67     70 76 110

Exploring Variation in Categorical Variables

Distribution of Categorical Data

Characteristics of Categorical Distributions:

  • Shape: Not applicable (Location? position?)
  • Center: The tallest bar
  • Spread: How different equal bars are

Variability in Categorical Distributions (Advanced):

  • Variability is measured different ways:
    • The larger the value; the more equal the bars.

    • Gini: \(1-\sum_{i=1}^k p_i^2 \quad \in [0, (k-1)/k]\)

    • Shannon Entropy: \(H=−\sum_{i=1}^k p_i \log(p_i) \quad \in [0, \log(k)]\)